The most important thing we can do to improve the performance of our React apps is to profile and measure our key components and interactions. That way we’ll know whether our changes are having a positive impact.
In the past, the recommended way of measuring the performance of our components was to use the react-addons-perf package, but the official documentation now points us to the browser’s User Timing API instead:
As of React 16,
react-addons-perfis not supported. Please use your browser’s profiling tools to get insight into which components re-render.
This API allows us to set high-resolution timestamps in our code to measure whatever we want. The most important methods in this API are mark and measure. We’ll use mark to set the start and end timestamps, and measure to calculate the time between the two.
Then we can get our measures using the method getEntriesByType with "measure" as the type:
window.performance.mark('myMeasureStart');
// The code we want to measure goes here.
window.performance.mark('myMeasureEnd');
window.performance.measure('myMeasure', 'myMeasureStart', 'myMeasureEnd');
window.performance.getEntriesByType('measure');
// [{
//   duration: 0.10000000149011612
//   entryType: "measure"
//   name: "myMeasure"
//   startTime: 4264378.099999999
// }]
Now that we know how to measure the performance of a piece of code, we’ll use these methods to measure how long it takes to render a relatively complex StockChart component from the Kendo UI framework, in a small example application:
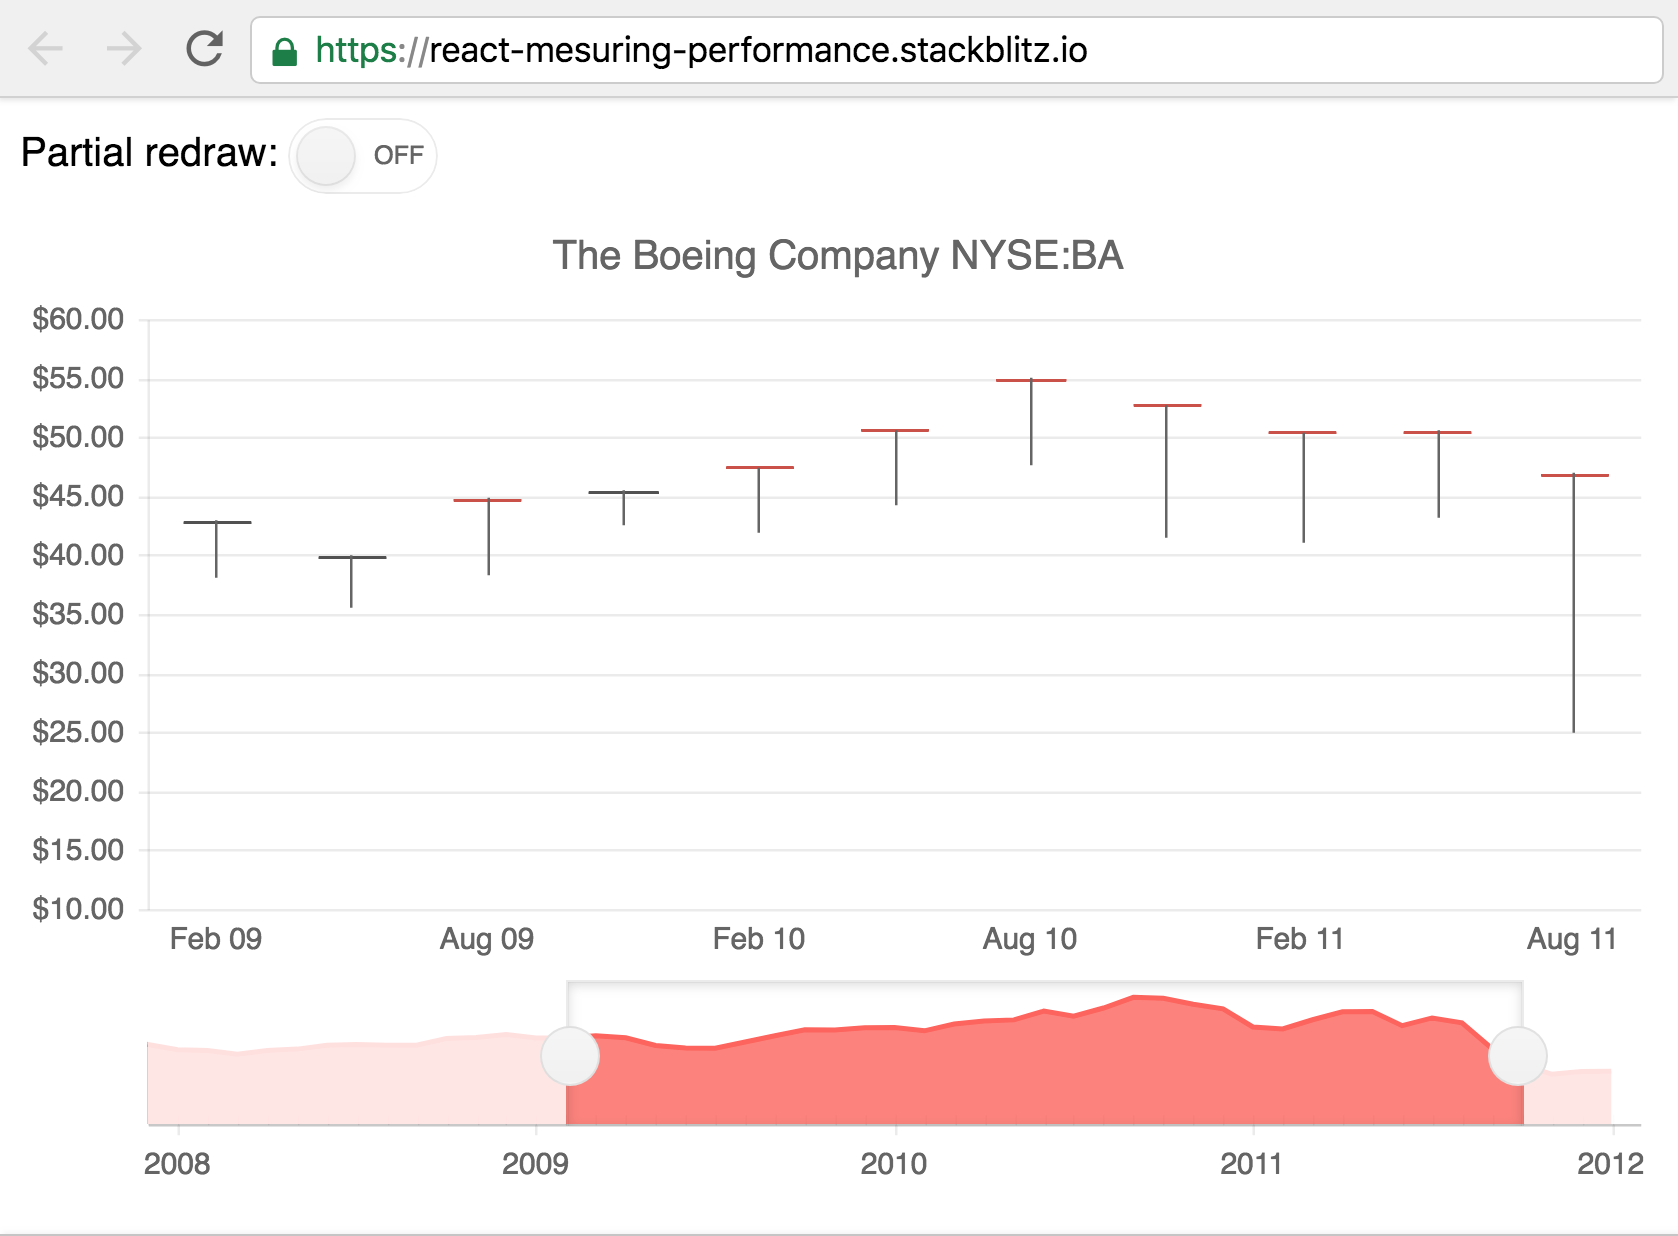
The component we want to measure looks something like this:
class Chart extends React.Component {
  render() {
    return (
      <StockChart>
        {/* ... */}
      </StockChart>
    );
  }
}
If we want to know the time it takes for the component to mount, we’ll set the first mark in the render method, and the second mark in the lifecycle method componentDidMount:
class Chart extends React.Component {
  render() {
    window.performance.mark('ChartMountStart');
    // ...
  }

  componentDidMount() {
    window.performance.mark('ChartMountEnd');
  }
}
In a similar way, we can set marks to know the time it takes for the component to update. This time we’ll use the componentDidUpdate lifecycle method instead.
To prevent both marks from being set inside the render method every time the component re-renders, we can keep track of whether the component has already been mounted with an instance property that we’ll call mounted. It’ll start set to false in the constructor of our component, and we will set it to true when the component is mounted. Then we’ll use it to set either the ChartUpdateStart or ChartMountStart marks.
class Chart extends React.Component {
  constructor() {
    super();

    this.mounted = false;
  }

  render() {
     if (this.mounted) {
       window.performance.mark('ChartUpdateStart');
     } else {
       window.performance.mark('ChartMountStart');
     }
     // ...
   }

  componentDidMount() {
    this.mounted = true;
  }
}
With all the marks set, we can call measure inside our componentDidMount and componentDidUpdate methods to know the time spent mounting and updating respectively:
class Chart extends React.Component {
  // ...

  componentDidMount() {
    this.mounted = true;
    window.performance.mark('ChartMountEnd');
    window.performance.measure('ChartMount', 'ChartMountStart', 'ChartMountEnd');
 }

 componentDidUpdate() {
   window.performance.mark('ChartUpdateEnd');
   window.performance.measure('ChartUpdate', 'ChartUpdateStart', 'ChartUpdateEnd');
 }
}
Once we have all the marks and measures set, we can call the getEntriesByType method to get the data as an array of objects.
We could then send this data to our backend, so that we aggregate it and show pretty graphs:
const measures = window.performance.getEntriesByType('measure');
fetch('https://example.com/api/measures', {
  method: 'POST',
  headers: {
    'Accept': 'application/json',
    'Content-Type': 'application/json'
  },
  body: JSON.stringify(measures)
})
We could also just see these measures in our browser’s dev tools. For example, in Chrome we would go to the Performance tab, press the button to start recording, execute some actions in our application, and stop recording. We’d then see our measures under the User Timing section:
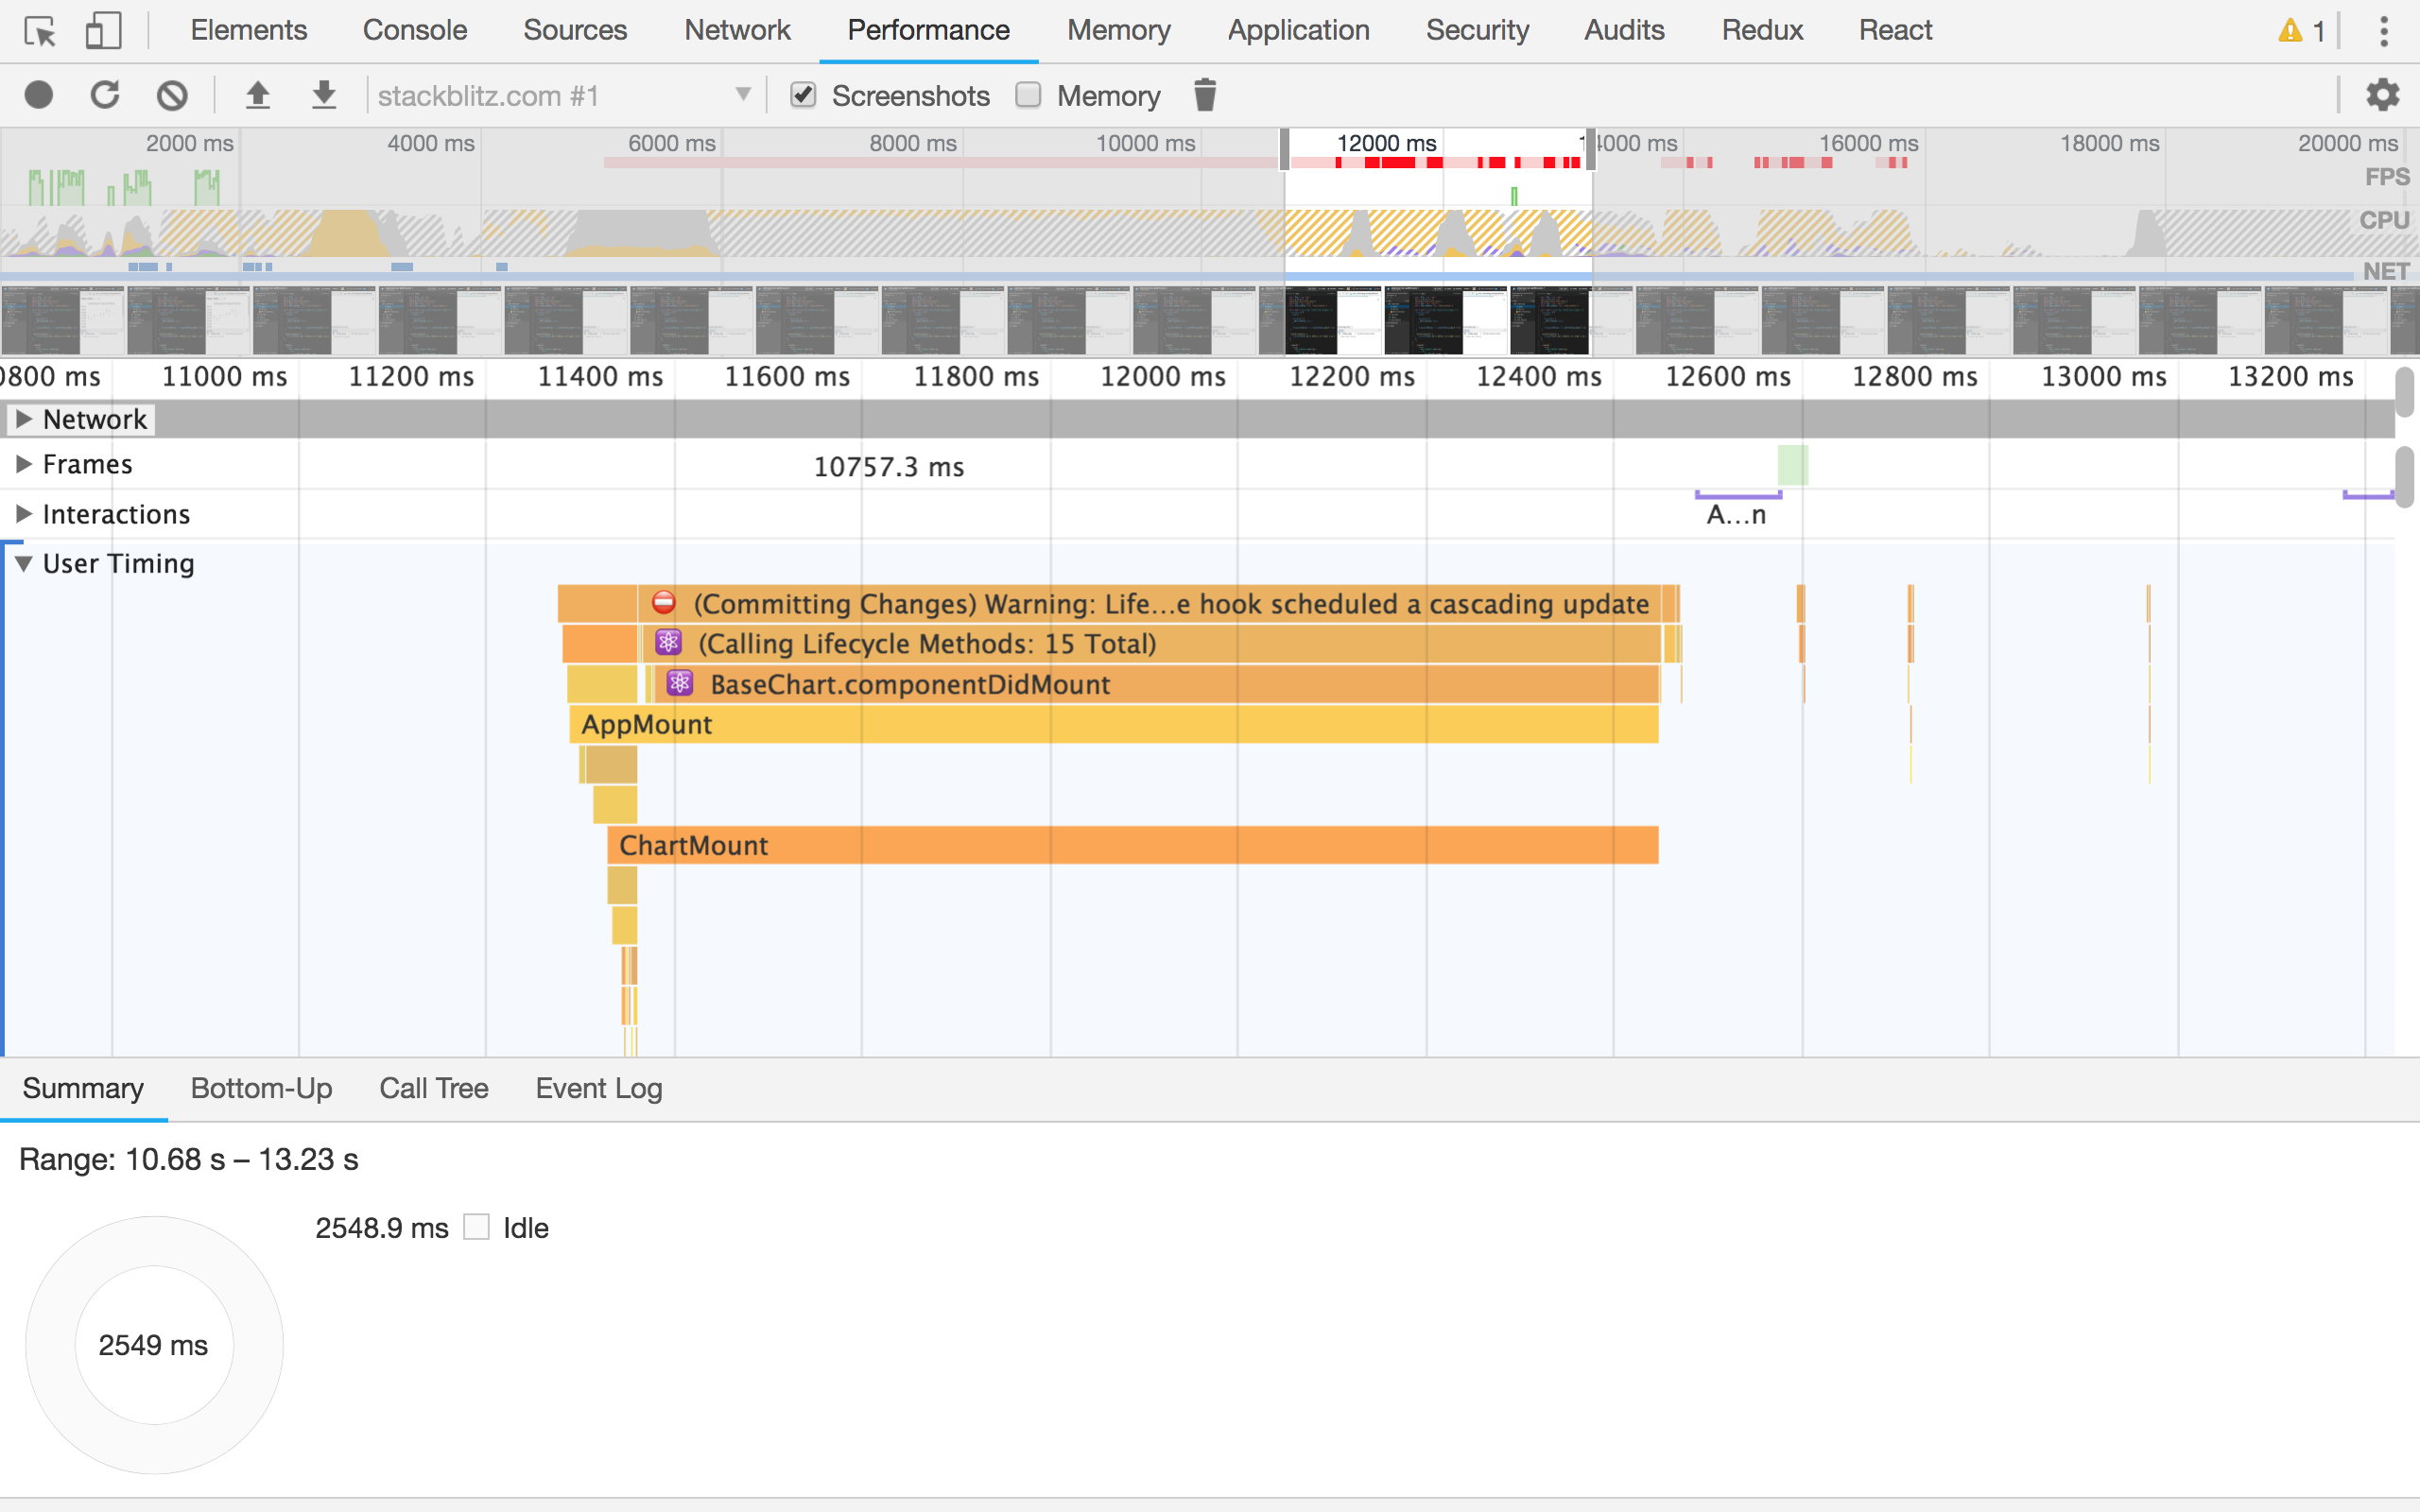
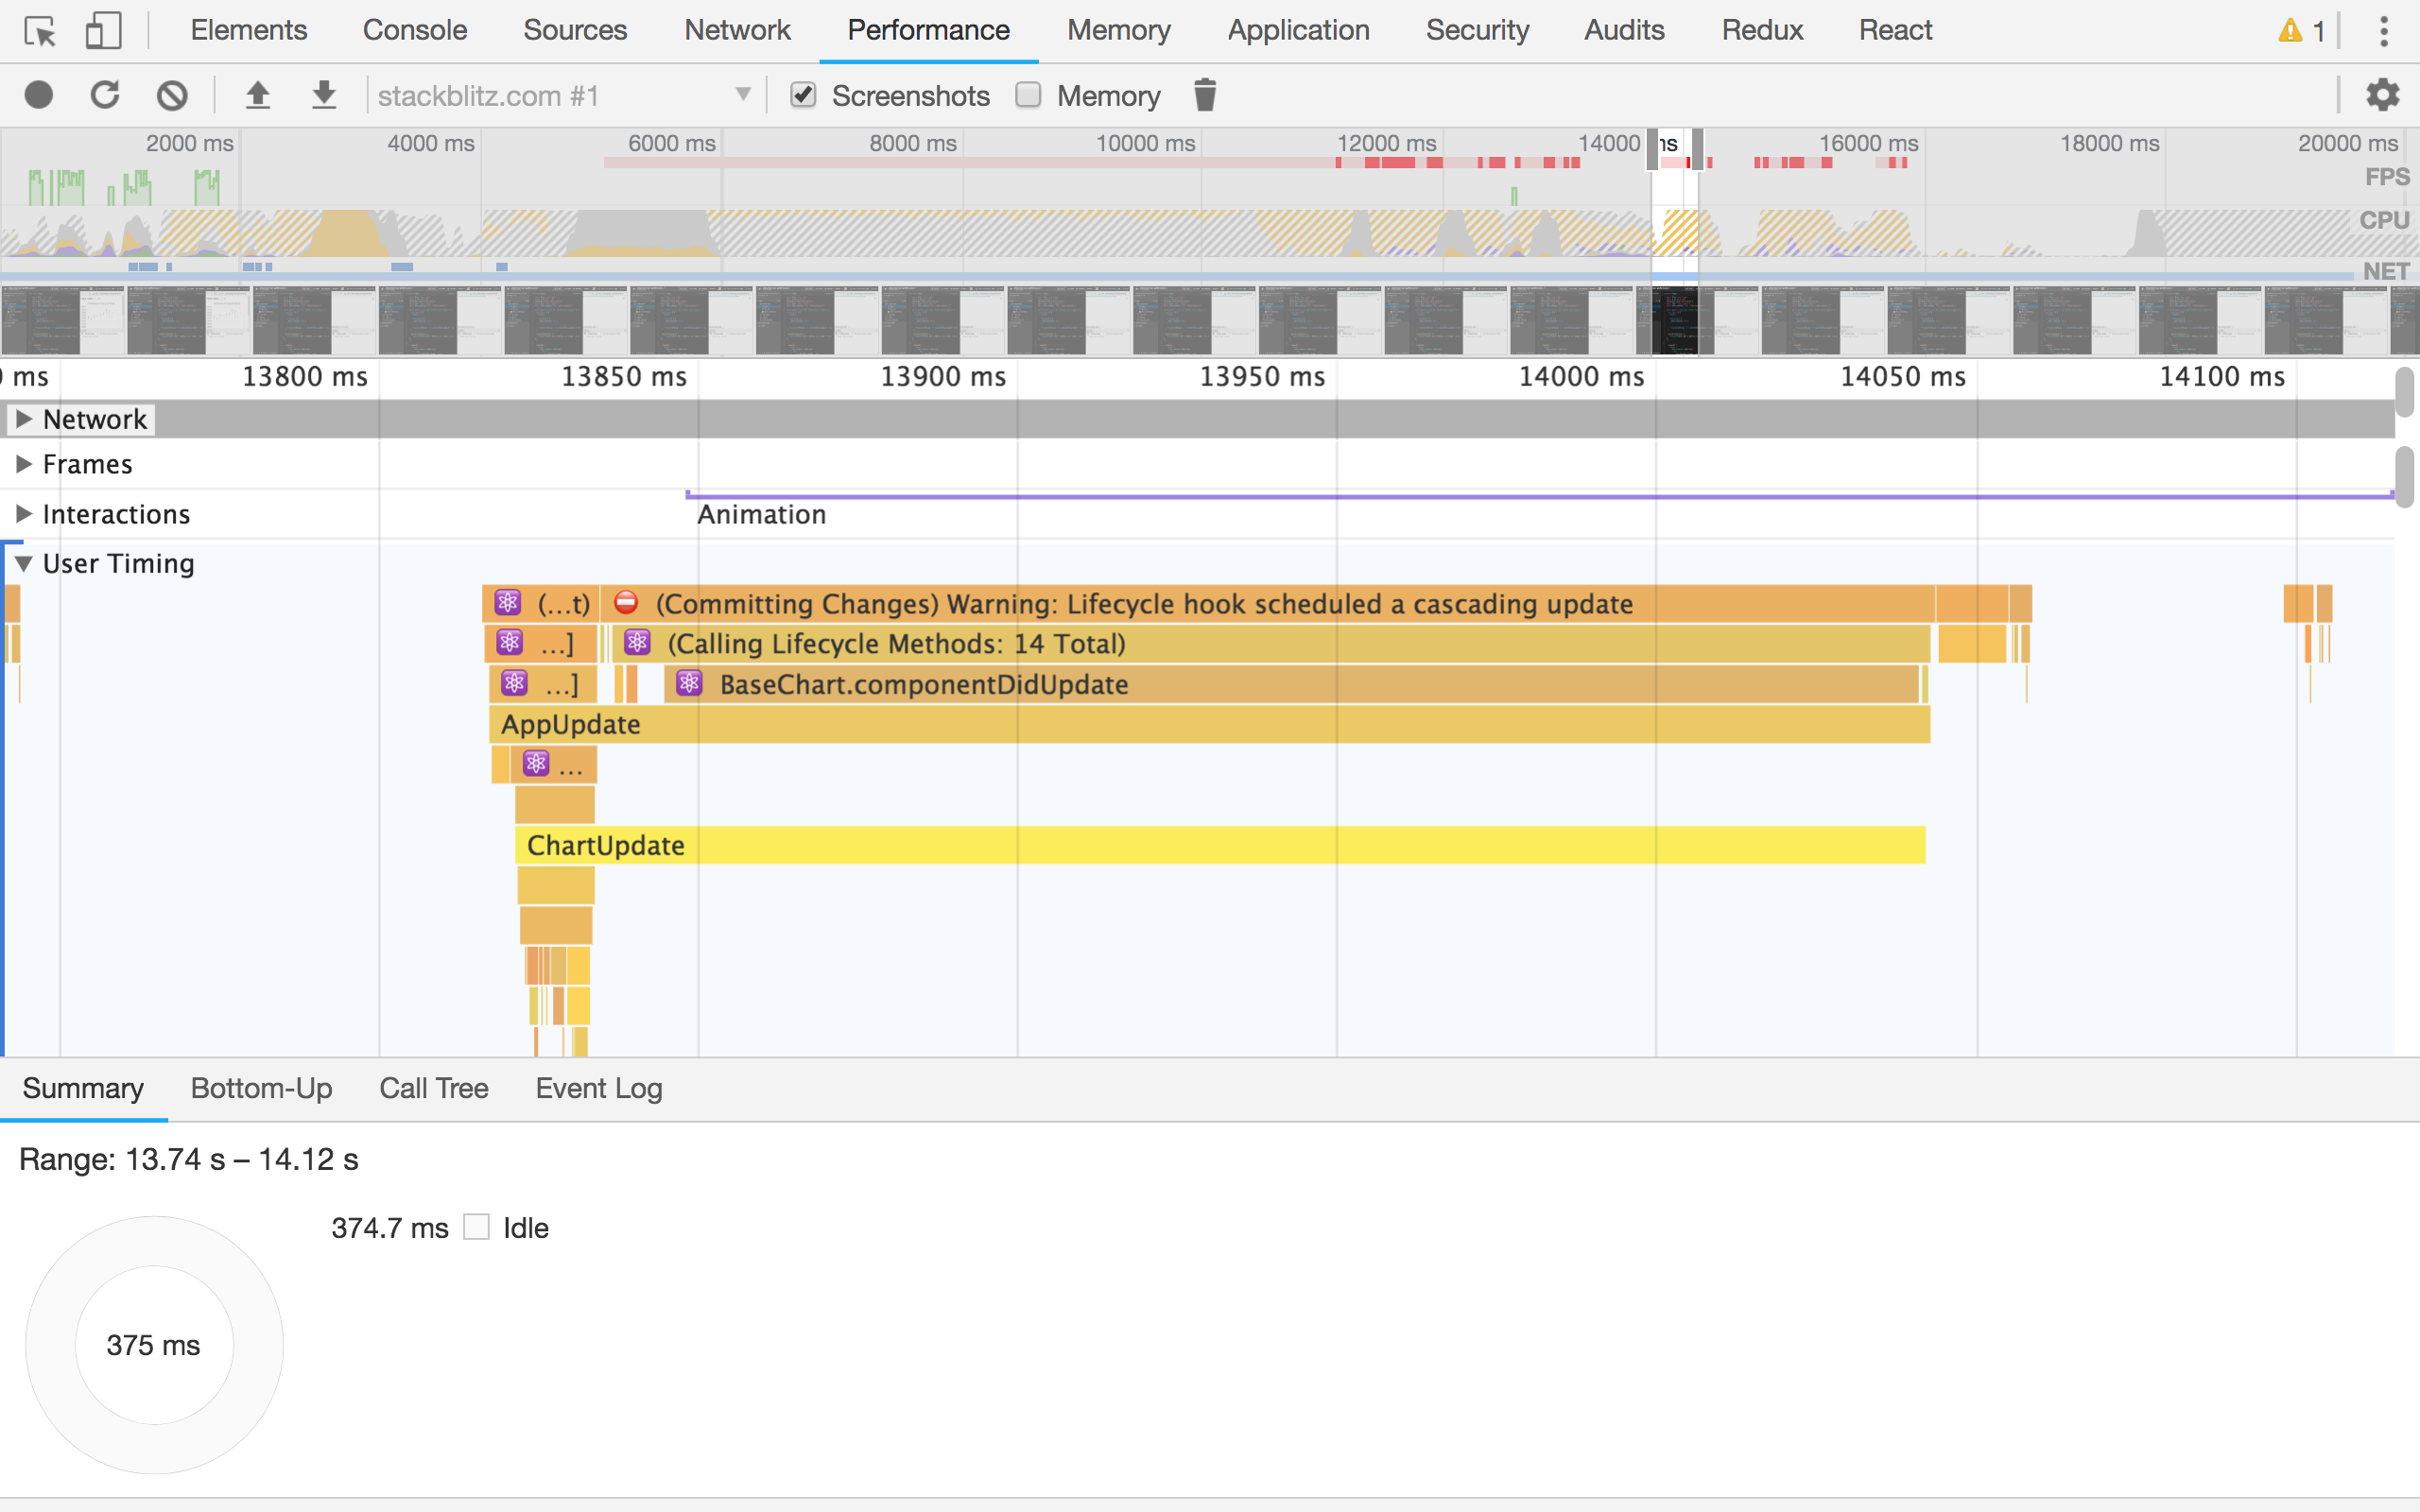
If we are using React in development mode, we’ll also see its own built-in timings (the ones with the emoji ⚛️) along with ours. However, in production mode we’d only see our own (AppMount/ChartMount and AppUpdate/ChartUpdate in the screenshots).
Now that we know how to measure the performance of our components, we can create a more generic solution that we can use on every component we want to measure, without the need to repeat the same code in each one.
We’ll create a new component called MeasureRender that will be responsible for creating the marks and measures. It will only receive two props, the name of the measure, and the children it needs to render:
class MeasureRender extends React.Component {
  constructor() {
    super();

    this.mounted = false;
  }

  render() {
    const { name } = this.props;
    if (this.mounted) {
      window.performance.mark(`${name}UpdateStart`);
    } else {
      window.performance.mark(`${name}MountStart`);
    }
    return this.props.children;
  }

  componentDidMount() {
    const { name } = this.props;
    this.mounted = true;
    window.performance.mark(`${name}MountEnd`);
    window.performance.measure(`${name}Mount`, `${name}MountStart`, `${name}MountEnd`);
  }

  componentDidUpdate() {
    const { name } = this.props;
    window.performance.mark(`${name}UpdateEnd`);
    window.performance.measure(`${name}Update`, `${name}UpdateStart`, `${name}UpdateEnd`);
  }
}
Then, we’ll wrap whatever component we want to measure with MeasureRender:
class Chart extends React.Component {
  render() {
    return (
      <MeasureRender name="Chart">
        <StockChart>
          {/* ... */}
        </StockChart>
      </MeasureRender>
    );
  }
}

class App extends React.Component {
  render() {
    return (
      <MeasureRender name="App">
        <Switch />
        <Chart />
      </MeasureRender>
    );
  }
}
Hopefully this will help you get a better idea of the bottlenecks in your app, and where you should be spending your time improving things.
This post was originally published at https://www.telerik.com/blogs/profiling-react-components-with-the-user-timing-api.